


How to debug front-end code
So you’re writing some code and you went to check it and it’s not working. How do you figure out what’s gone wrong so you can get back to coding?
JavaScript
So much of what we do on the internet now is in JavaScript. I bet you are working on some sort of framework that puts your HTML and CSS into your JS so you can put your JS into some HTML so the JS can write your HTML and CSS back into the HTML again. Pretty awesome right? Confused? Of course you are.
Console errors
Step one when faced with a problem that is probably caused by JavaScript is to open up the DevTools panel and have a look in the console. Anything red probably needs reading carefully and fixing.
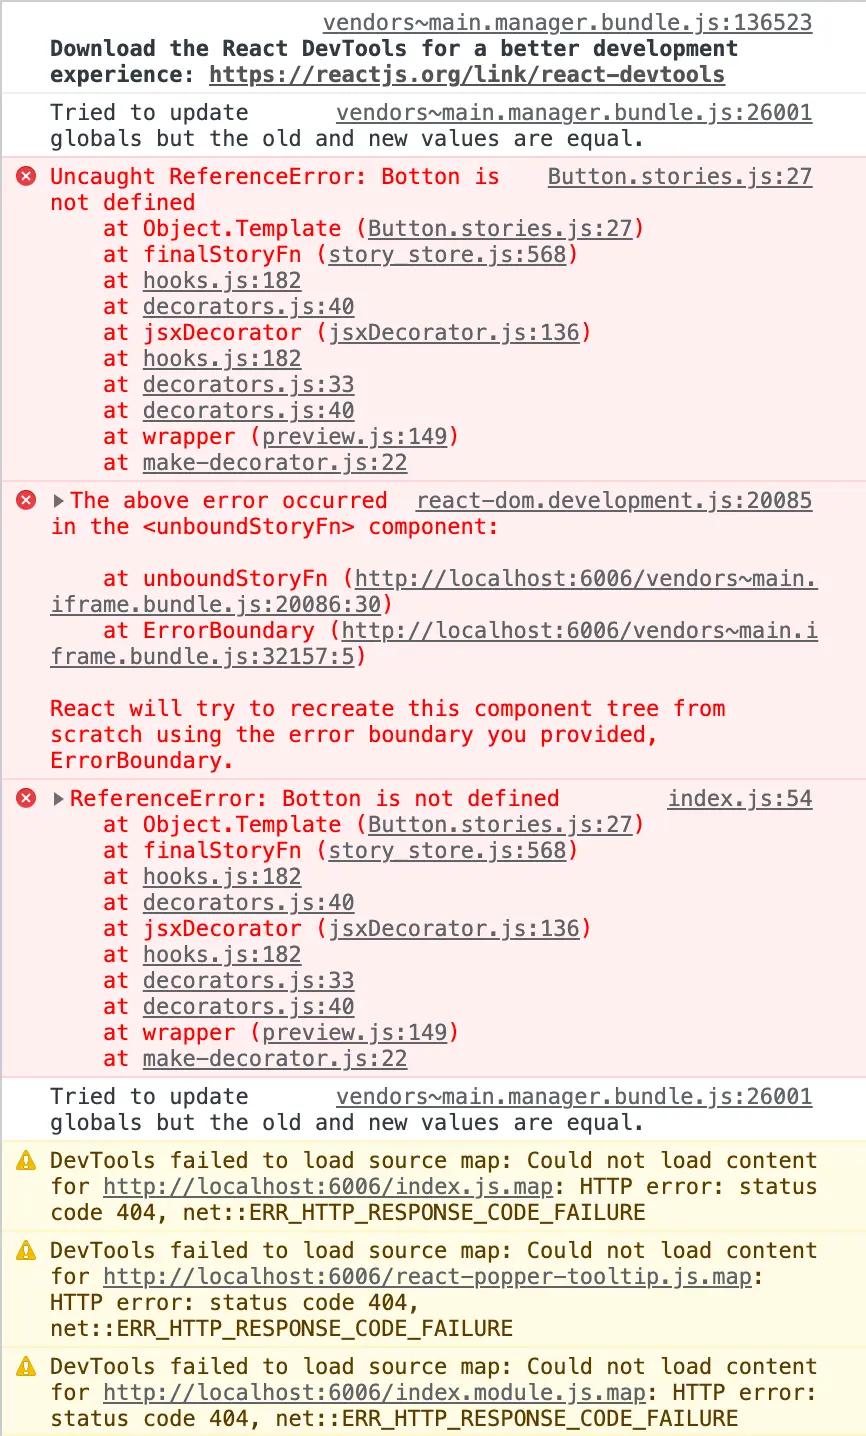
Here, we can see “Botton is not defined”, looks like I misspelt “Button”.
Where’s the error?
The lines below show the stack trace which is each function that was called to get to the error so you can trace back to the source of the problem. We can usually expect the problem to be in one of our files, rather than a package. You can hover over the underlined file name to see if it’s us, or a node module, or (rarely) a chrome plugin.
Clicking on the filename will take you to the source panel where it will highlight the failing line.

This file might be minified, so you can choose to “pretty print” it, which will stop it all being all on one line. Look for the squiggly brackets in the bottom left of the source panel.

It may also be uglified, where all the variables have been replaced with one/two letter names that don’t make sense. In this case you might have to use the shape of the code to figure out what it means in the original source. Look for things that don’t get updated by the uglifier, such as brackets and math symbols.
What’s around the error?
If you want to find out what the values of things are around the failing code, you can insert a breakpoint by clicking to the left of the line of code. This will pause the code execution when the line runs and you can hover over different values to see what they are at the time of execution, as well as stepping into functions and seeing each line run individually.

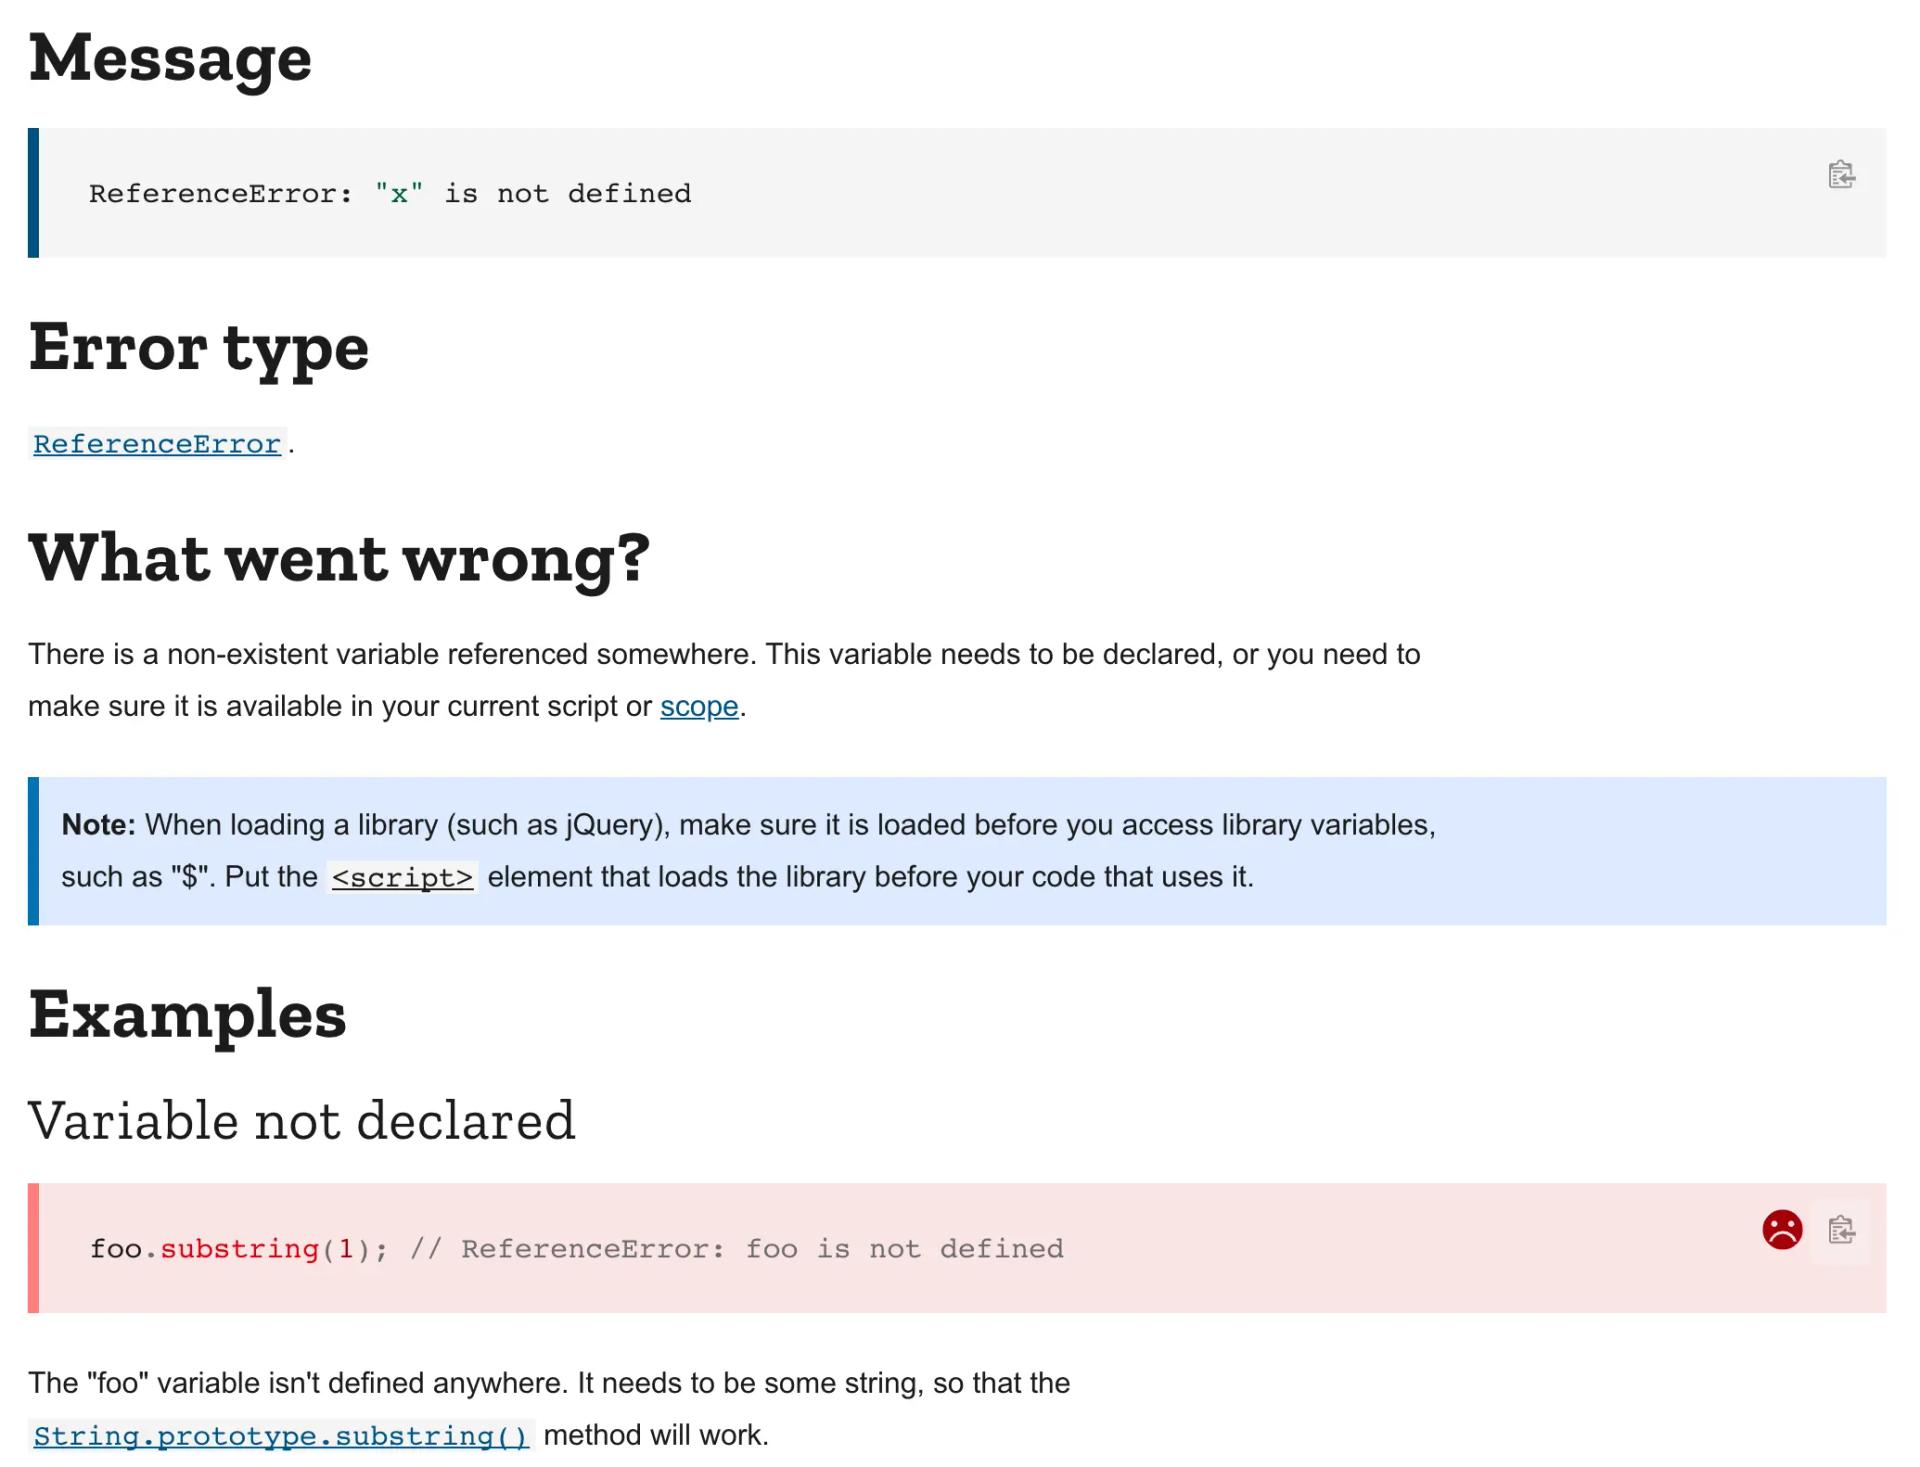
What if I don’t understand the error?
Sometimes the error is hard to understand or references something you don’t know about. Try copying the main part of the error message, without the bits that are specific to your project and dropping them into Google search. The best resources are probably Stack Overflow for generic JavaScript errors and GitHub issues for the module if it seems specific to an npm module you are using.
In this case we can Google “Uncaught referenceError is not defined JavaScript”, which gives us quite a nice result on the MDN docs.
Linting errors
If there are no console errors, head back to your text editor and have a look for linting errors. If you don’t have a JavaScript linter, you should get one now. Probably eslint.
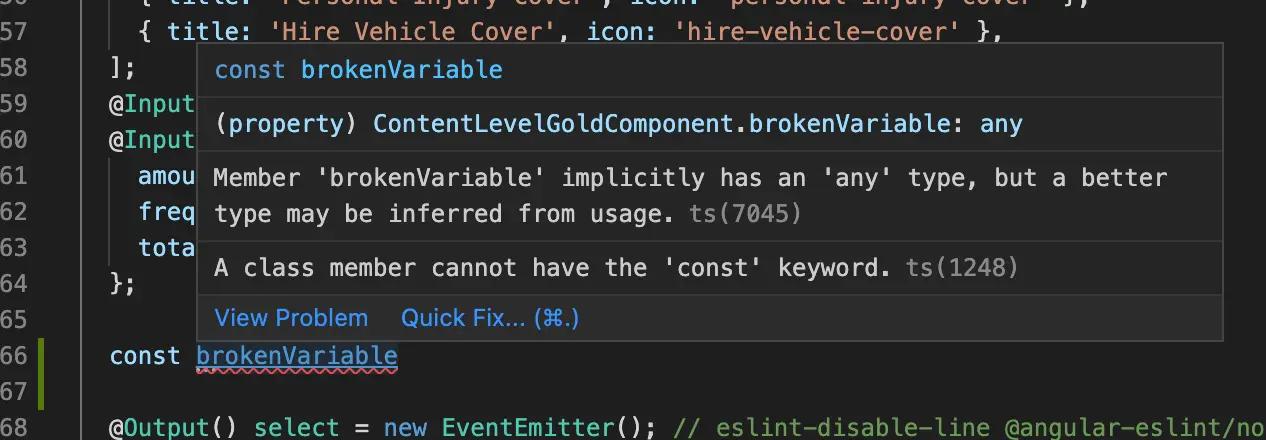
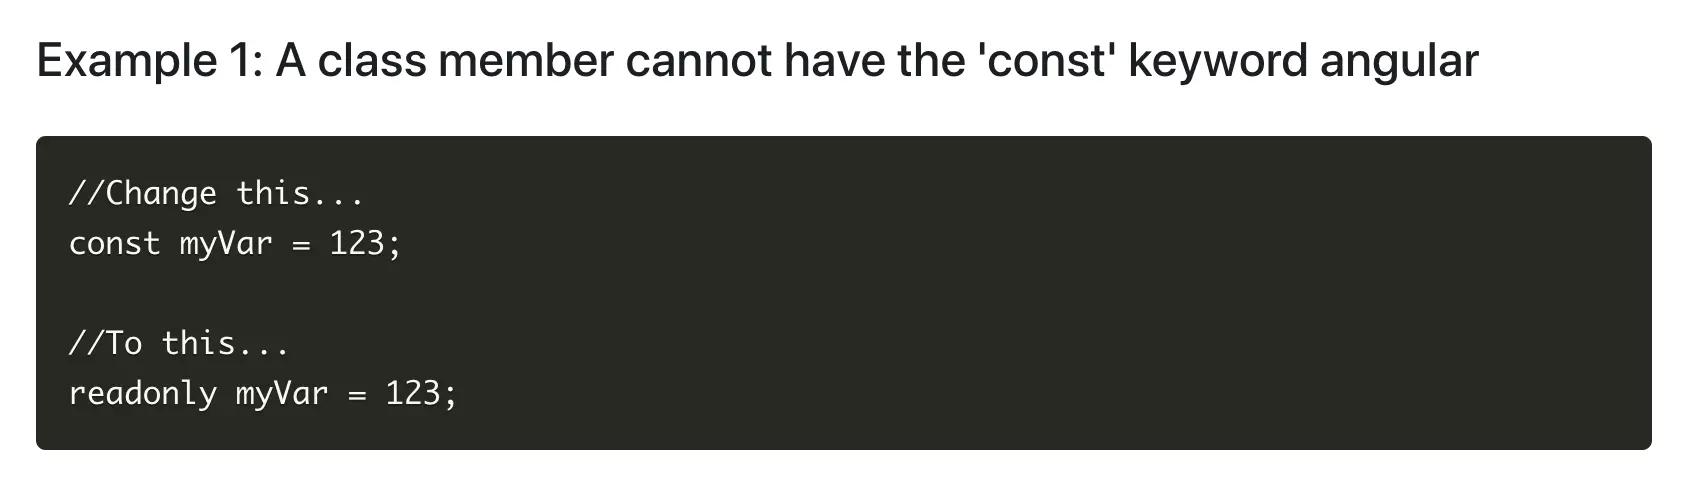
Hovering over this linting error gives us a message that “A class member cannot have the 'const' keyword”. Googling this error shows us that classes have properties that don’t require const before them.
Console.log everything
If there are no console errors and no linting errors then it’s time to dig in and find out what’s happening. Something, somewhere, is behaving in an unexpected fashion.
Either:
- The code you think is running is not running or;
- A value you think is something, is not that thing.
Is the right code running?
A classic console log method is just to log out an identifying word or two console.log('init') console.log('resize function'), etc. Then, recompile the code and go back to the console to check if your logs are there.
Make sure they are close to the code you want to be running and that they run in the expected order.
Are the variables correct?
Once we know which code is running, we can start checking the values are correct. You can log values of variables or even log the results of if statement conditions to see if they output the correct result. We want to get closer and closer and more detailed until we can find the exact characters that are not behaving in the expected fashion.
You can console log multiple values in a single statement, which can be quite nice for label/value pairs console.log('Foo: ', foo);

Gotcha: Are the variables the right type?
One thing that can catch you out is printing a variable with a console log, but it’s not the expected type. The number 1 and a string with a value of 1 will both look the same in the console.
If that might be the case you can get the variables type using typeof e.g. console.log(typeof foo) // string | number | etc
Digging into node modules
Sometimes, the offending code is in a node module file. Often, you can open up your node_modules folder and navigate to the module where the code is running. Depending on the build setup, you may be able to make edits directly to the source and see them compile and update in the browser.
There’s a few gotchas to this:
- You might need to restart the server in the terminal
- The module may come with transpiled and source code and you need to figure out which is running
- You might need to kill your node modules cache
With this many gotchas, you don’t really want to be digging in to node module source if possible as it can be super awkward to debug.
Is it running in the right order?
Timing in JavaScript can be interesting. With render cycles and async functions, code does not always run in the order you think it should. By dropping in a sequence of console logs close together before/after/during the code you are interested in, you can check they run in the order you expect them to and debug the values at the time the log is executing.
Gotcha: Logging objects
Logging objects can be a bit weird as sometimes the value of the object is only evaluated at the time you open the object in the console to inspect it rather than the time is was logged in the code. For this reason, it’s always better to log primitives (strings, numbers, simple values) where possible, in case the value you are looking at is not what it was when you wanted to look at it.
If you do need to log out an object, you can force it to a string with JSON.stringify, and then console log that.
What if I can’t log?
In Angular templates or JSX or Vue templates, you don’t have access to console.log, but you can give yourself access by creating a method on the component you are working on. Either creating a new log function in React or a method like this in Angular/Vue that you can call and pass values to from the template.
log(thing) {console.log(thing);}
Terminal
If your console logs aren’t appearing, but you are confident the code is right, or if you are running server side code then it’stime to look in the terminal.
Terminal output is like the console output in the browser, for server side JavaScript, this is where the console logs appear.
Is it updating the bundle?
You should get an output in the terminal when you save a file. These often look really really similar so it’s best to have the terminal somewhere visible as you save the file so you can see it change.
Often if you create a file whilst the server was already running, it doesn’t know to watch it for changes and will not recompile the code so you'll need to restart the server.
Has it crashed?
Sometimes the server crashes due to an error or a memory problem or just gremlins. If it has stopped running, scroll up and try to see if you can see what caused it to crash out. As you get into setting up your own bundlers, you might be able to update them to handle errors like this more gracefully.
There can be a lot of text so look out for changes in the pattern/shape of the text as you scroll as that is usually where the errors or interesting bits are.
Delete everything that works
With the size of apps at the moment, there can be a lot of noise that causes confusion when debugging. My final technique is usually to start removing code we are not interested in, in order to isolate the problem. Less code = less potential problems = less things to understand.
By removing as much code around the problem as possible, whilst retaining the same result, you can narrow down to the exact source of the issue and start the logging process to find the unexpected value.
The essence
- 99% of debugging is finding the location of the bug.
- Check the code is running.
- Check all values are what you expect them to be. Never assume.
- Remove noise.
- Isolate the issue.